Improvement of defect rate and use of Pareto charts
In this article, I will talk about the theme of "Improvement of defect rate and use of Pareto charts". As a production engineer, you will always be involved in activities to improve the defect rate. Based on my experience with production engineer, I will outline the concept of how to improve the failure rate.
What is the defect rate on the manufacturing site?
Before we get into the main topic, let's first take a brief look at the current state of the manufacturing industry.
In the industry where I worked in the past, the failure rate of new products was around 5-10%, and even for mass-produced models that had been in production for years, the failure rate was 1%.
Define defect rate here as follows.
(Defect rate) = (Defective scrap value) / (number of units produced on the production line x value of products)
In other words, the amount of scrap money / (sales amount + scrap money amount).
The reason for this definition is that if a large number of defects occur at the level of inexpensive parts at the beginning of the assembly line, the impact on the profit is low even though the number of defects increases, while the number of defects in the final product is small, but the impact on the profit is large.
For the sake of clarity of business impact, we define it here in this way.
In short, the new models make up 5-10% of the scrap value equivalent.
Why is the defect rate so high?
To the average person, you may be surprised why it's so much. For new models, there are many problems that only come up after mass production. This is caused by a wide range of problems in product design, mass production equipment, operational errors, and component quality problems.
You can imagine the difference in the level of control between making a few products in the lab and producing thousands of products every day.
So, the initial start-up of new product will inevitably have a high defect rate.
On the other hand, it is no simple task to reduce the defective rate to zero, even for products that have been in mass production for many years.
What remains in the end is a chronic factor defect.
There is a certain percentage of inevitable defects in every mass production process.
Some are design issues, others are in-process issues or part quality issues.
In any case, once mass production has started, changing the design of the product, remodeling the equipment, or changing the specifications of the parts is not practical due to the risks (as well as the costs and labor) involved.
Depending on the situation, this will be planned, but it will still take about six months to implement.
It's a long preface. From now on, I will be talking about the defect rate.
Organizing defect rates and defective items
The first step to improve the defect rate is to investigate the details of the defective products.
We summarize the defect rate from the number of units produced, defective items, and defective scrapped items and organize this by date.
We will separate chronic defects from those that occur unexpectedly. What should be addressed is highly effective chronic defect.
Introduction of the Pareto chart
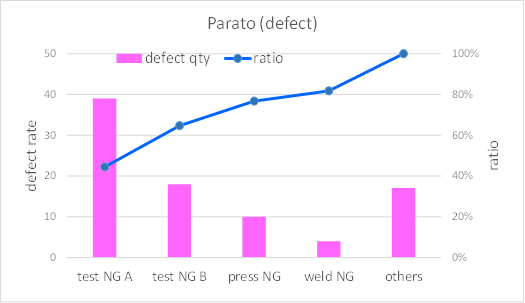
The next step is to create a Pareto chart of the defective items in the order of failure rate .
*The defective rate here can be determined by each process (number of defects/number of inputs).
It looks like the following image. Since the purpose of the document is not to create a document, minor defective items can be summarized as "Other".

Effective use of Pareto charts
After organizing the Pareto chart, you will prioritize the activities, starting with those with the highest defect rates.
Since it is not possible to deal with all items at once, you will focus your activities on two or three defective items. All other bad items are ignored once.
As we all know, internal resources are limited. Problem solving is not so easy.
This is the same concept as running a company, though. The idea is to figure out where to focus their resources to maximize the results.
(Ideally, of course, you should take care of all of them, if possible.)
Approaches to Improving Defect Rates
Once you've made it this far, all you need to do is put it into specific activities.
If possible, I would like to explain with specific examples, but I refrain from describing specific individual cases because I don't think it would be helpful.
There is almost no such thing as an exact same case of defective improvement at manufacturing site, and we have to investigate each defective case in detail and take countermeasures.
On the other hand, I don't think it would be easy to understand if the explanation is too abstract, so I'm going to give you a reference for your thinking. I'll post links to previous articles at See below if necessary.
Histogram
TIG-welding
The key to improving a defect is to persistently investigate the cause of the defect.
It takes time, but it's a process of gradually picking up on trends and testing hypotheses. In some cases, investigation and consideration of countermeasures may take weeks.
You may feel like you've been doing this for a few days and getting no results, but don't get discouraged or lose your confidence.
It's no surprise that it's not so easy to solve, since we're already dealing with a problem that a lot of engineers have tried and failed to solve.
This is an overview of the Pareto analysis and the concept of activities to reduce the defective rate on the manufacturing site.
RELATED) The need to properly understand the essence of problem and common misunderstandings
RELATED) Overview of 5-why Analysis at manufacturing site
RELATED) Problem Analysis Methods for Manufacturing Sites (Use of Histogram)