Problem Analysis Methods for Manufacturing Sites (Use of Histogram)
In this article, I will talk about "Problem Analysis Methods for Manufacturing Sites (Use of Histogram)". Process capability is an indicator of how stable production process is. This is something that production engineers will be familiar with, but surprisingly few people are able to put it into practice. I took it up this time because it is useful in solving the problem.
【content】
- What is process capability?
- Introduction of Process Capability (Histogram)
- Example 1 (when the center of the specification does not match the center of distribution)
- Example 2 (when the capability does not match the specification setting)
- Example 3 ( Abnormal distribution )
- Advantages of Process Capability and Histograms
What is process capability?
Process capability is an indicator of how stable a process is.
The detailed formula is omitted here, but it is an indicator of how the standard deviation is distributed relative to the specified width.
If the process capacity is not sufficient, it means that the process is in an unstable state that produces defective products.
It's also one of the decision-making indicators in management reviews, and when we release new production line, we conduct process capability study across the entire process.
Process capability of 1.67 is required for important characteristics (functional and safety characteristics) called "special characteristics".
In addition, before and after process capability evaluation is also required when requesting a process change to the customer.
These are the general introduction of process capabilities.
In addition to the events mentioned above, capability study is also useful in our daily work, but for some reason many people don't use them effectively in their daily work.
For example, if you want to improve the defect rate, the process capability study is also an effective analysis method. This is because it allows us to find out if the distribution of defects is abnormal.
Introduction of Process Capability (Histogram)
Before we get into the details, let me introduce the histogram.
Histogram is graphical representation of the distribution of data. It is very useful for visualizing "process capability" things.
*You can create a histogram, using Excel.
For more information, try adding the Excel add-in feature.
There are two points to look at in a histogram
(1) The center of the distribution in relation to the median of specification
(2) Relationship between the end of the distribution and upper and lower limits of specification
The following reference case illustrates this relationship.
Example 1 (when the center of specification does not match the center of distribution)
The first example.
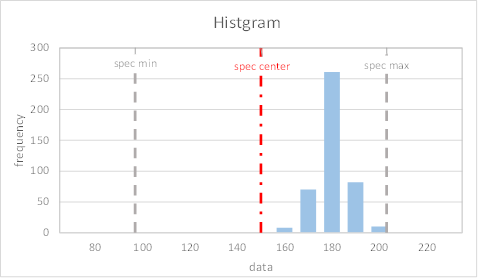
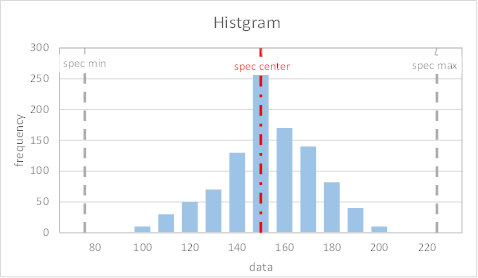
As shown in the histogram below, this is a case where the distribution is normal, but there is no margin for specification width.
points to look at.
(1) The center of specification does not match the center of the distribution.
(2) The distribution is not generous with respect to the upper limit.
Therefore, if production is continued in this condition, defective products that exceed the upper limit will eventually be produced.
There are two measures to take.
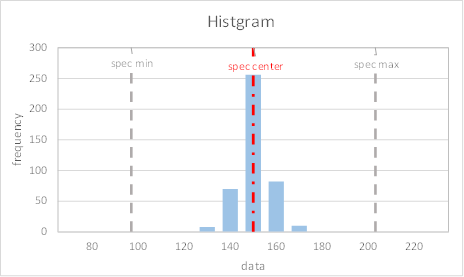
Countermeasure A) Adjust the parameters in the process to shift the center of distribution to the center of specification.
This is an example of something like "press-fit dimensions.
For example, suppose that the specification of press fitting dimensions are 90.0±0.1 mm.
If the current distribution center is 90.07mm and is close to the upper limit, adjust the press-fit position to make it close to 90.00mm. This will greatly improve the process capability.
By doing so, the histogram would look like this. The process is now more stable because there is more room against specification limit.
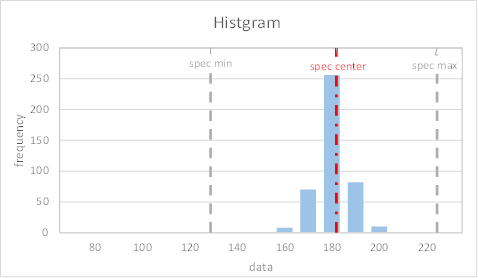
Countermeasure B) Change the specification settings
On the other hand, in some cases, it may not be possible to adjust the data distribution in the process. Example of "press-fit load" is one of them. In this case, the only option is to have the product designer change the specification.
For example, if the press-fit load standard is 1000-3000N and the current distribution center is 2800N, the only options are to have the tolerance of the part reviewed or to have the specification setting reviewed. It's the problem that can't be handled in the process.
The histogram after specification change looks like this. This method also gives you more margin against the upper limit and makes the process more stable.
Example 2 (when the capability does not match the specification setting)
Next, we will look at the second case study.
The same analysis of the point.
1) The center of specification and the center of distribution are nearly identical, so it's not a problem.
2) There is no room for either the upper or lower specification.
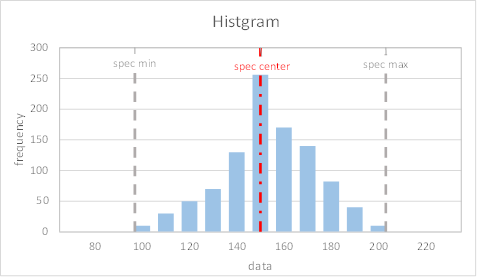
In this case, there is a problem with specification setting, so you will have to have the specification changed. After the change in specification, the histogram will look like this. This gives you more margin for both the upper and lower standard limits.
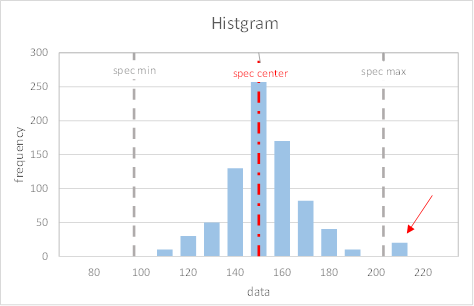
Example 3 (Anomalous distribution)
Third example.
The data shown as red arrow in the histogram are completely anomalous in distribution. This may be due to an abnormality in process or in component.
Advantages of Process Capability and Histograms
In this way, process capabilities and histograms can be used to visualize the problem.
Once you learn the right techniques and use them well, investigating the cause of the problem will gradually clarify the issue.
As mentioned above, there are issues that can be solved within the process and issues that cannot be solved within the process.
For each case, the actions to be taken will change.
In some cases, there are also process capabilities related to product characteristics (electrical and functional characteristics).
In this case, FTA analysis (see other article) will be needed to investigate the multiple causes of the problem.
Without deep understanding of the product structure and characteristics, the right approach is difficult to take.
RELATED) Problem Analysis Methods for Manufacturing Sites (Introduction and Use of FTA)
RELATED) The need to properly understand the essence of problem and common misunderstandings
RELATED) Overview of 5-why Analysis at manufacturing site
RELATED) Introduction of Pareto charts
RELATED) Position of the load cell to measure the press-fit load correctly